Make a stock comparison video
Type a symbol and its daily prices load. Your browser renders the MP4.


SPY against a savings line set to 2%. January 2010 to July 2026, $10,000 into each on the first day. Invest mode, 9:16, rendered in the browser.
What it didThe average viewer watched 12 of its 18 seconds. 3,470 people saved it and 984 followed the account off it.
Open the editorThe four panels that made it
- 01
Switch to Invest
Compare shows percent change. Invest shows what a sum of money became.

- 02
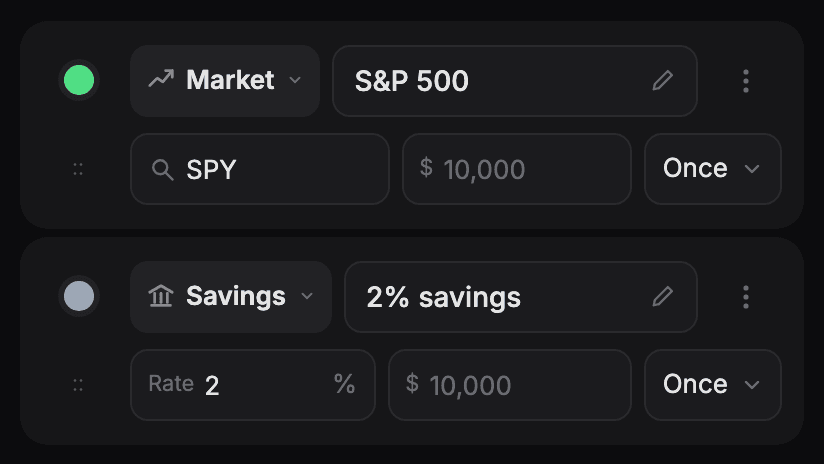
Type SPY, then add the savings line
The daily prices load with the ticker. Set the second line to 2%. Give both $10,000 on the same day.
- 03
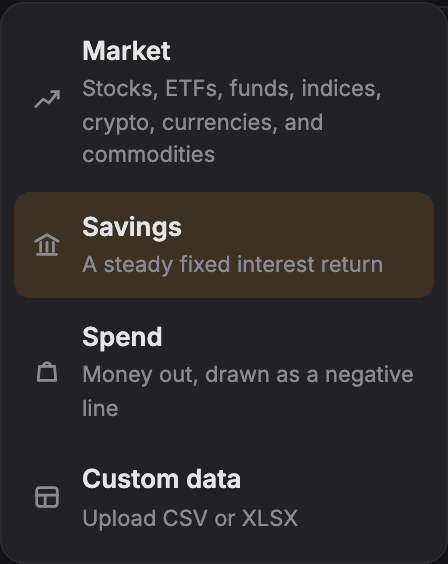
Savings, spending or your own file
Savings is a fixed rate. Spend draws money out. Custom data reads your own file.
- 04
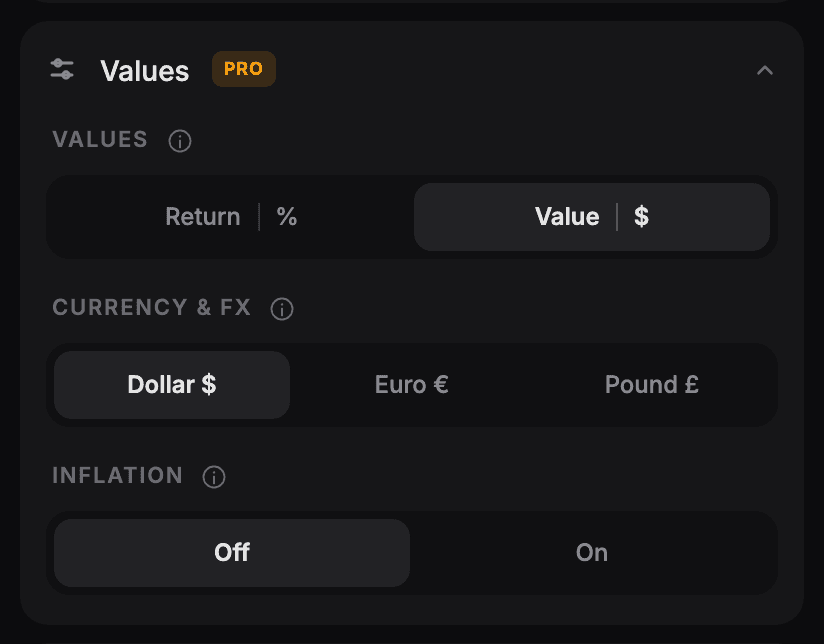
Decide about inflation
Off, the savings line goes up. On, it goes down. This reel used Off and said so in the caption.
Then press Generate. A free account saves the file.
What you skip
- Find a price file, clean it and import it.
- Set keyframes in After Effects and wait on a render queue.
- Brief an agency, wait for a quote and review two rounds.
- Put a card in before you have seen one finished video.
Questions
What can I put on the chart?
Anything Yahoo Finance covers: stocks, ETFs, indices, funds, crypto and commodities. A line can also be a savings rate, a monthly investment plan or money you spend. Pro reads your own CSV.
Do I need to upload data?
No. Type the symbol and the daily prices load with it. Flourish, Datawrapper and the bar-chart-race Python library each start from a file you supply.
How long does one video take?
Your own computer renders it in seconds. Nothing uploads and nothing queues. The rest of the time is your choice of symbols.
Can I make this chart on the free plan?
No. The savings line needs Invest mode, and Invest mode is Pro. Free compares two symbols as percent change.
Can I make videos for Reels, TikTok and Shorts?
Yes. 9:16 is the default and the only free shape. 1:1, 4:5 and 16:9 are Pro. chartrace lays the chart out again for each shape and does not crop it.
Is it free?
Free gives you three videos a day, 15 seconds each, 9:16, with a chartrace mark on the frame. A free account saves the file. Pro gives you two minutes, all four shapes, no mark, plus bar races, dollar values and the style controls. $29/month or $199 once for lifetime access.
Read next
Make one yourself
Pick two symbols you argue about. Render one video.
Open the editor